New CEO for Axiell – accelerating industry leadership through improved access to world’s collective knowledge!

New CEO for Axiell – accelerating industry leadership through improved access to world’s collective knowledge!

Read more

V-insight

Statistical analysis for more insight and better decisions

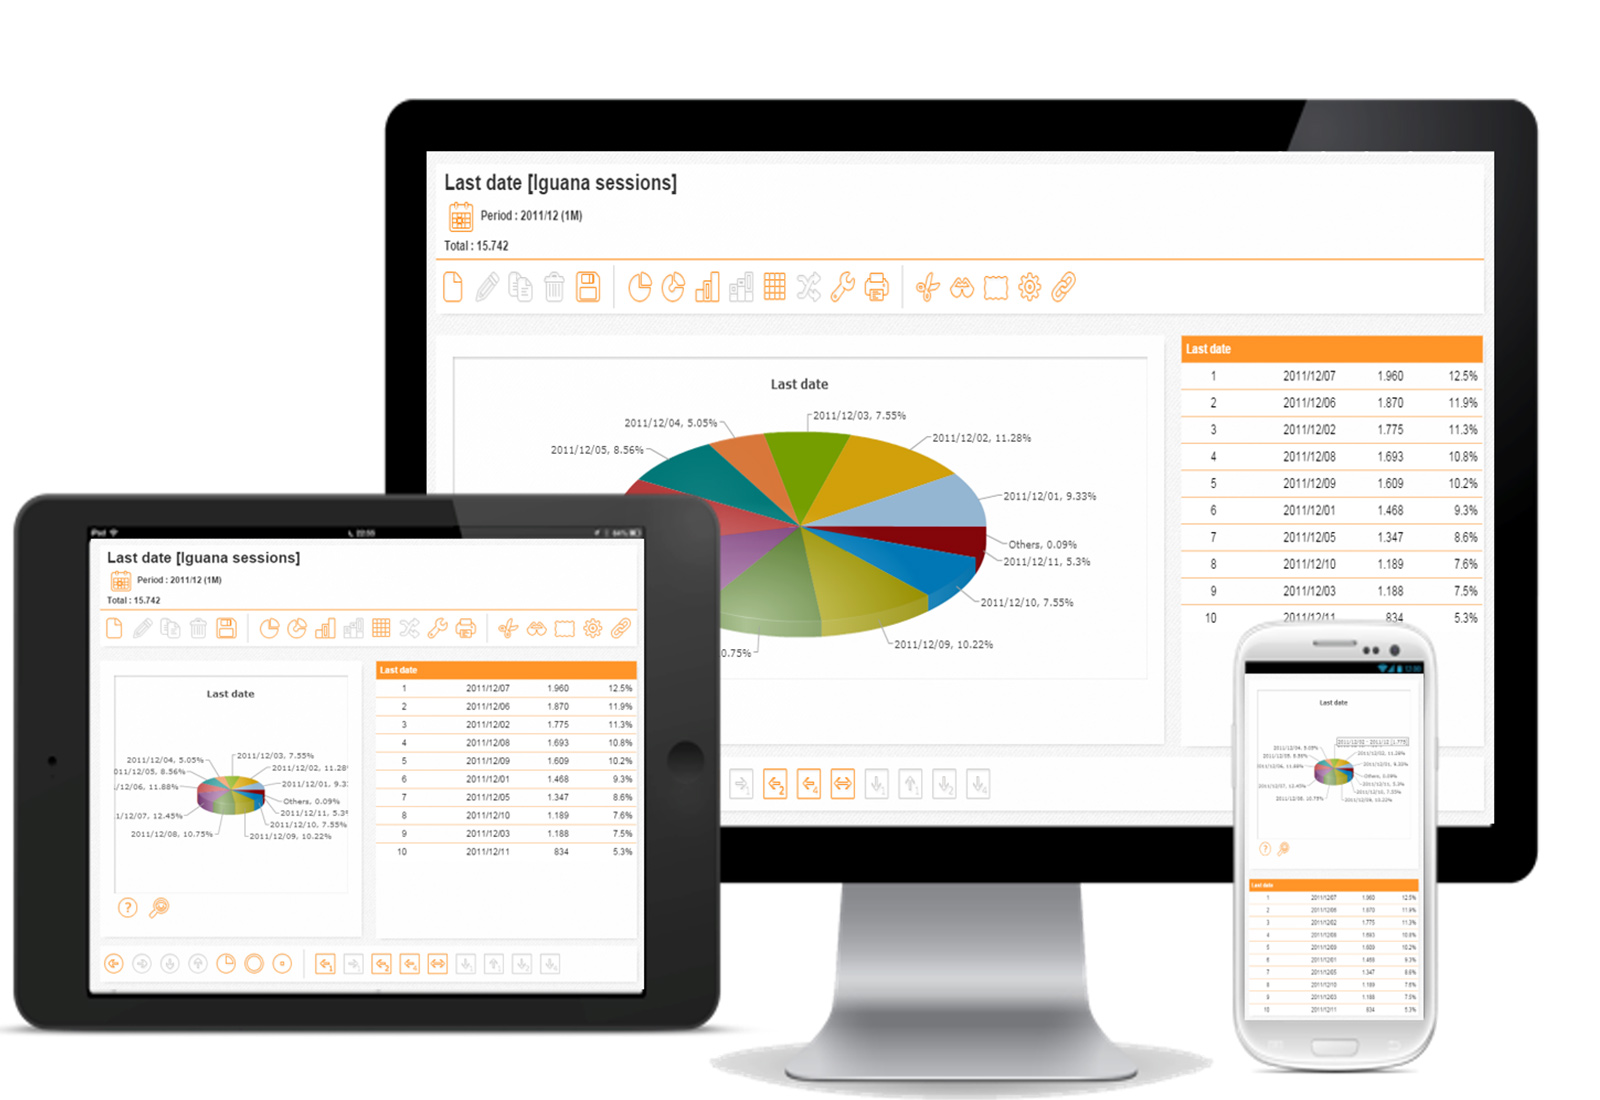
Gaining insight into relevant, up-to-date information about usage and trends is essential for decision-making in libraries. With V-insight, data analysis and visualization come together in a browser interface, combining in-depth analysis with ease of use.

V-insight improves effective analysis into each library’s area and helps each department make better decisions with a user-friendly application dedicated to their business.

Get in touchDownload Product Sheet

Critical statistical analysis

A powerful statistical portal

V-insight provides libraries with the performance indicators and measurements they need for critical statistical analysis. The web-based interface automatically creates and publishes dashboards that can be customized so each user can track specific chosen data at a glance in a graphic environment. Users just need to select periods (day, month, quarter, calendar year, fiscal year) and items of interest to access accurate data analysis and visualize information in a visually appealing format to support their decision making and actions.

V-insight easily adapts to specific security requirements. The library can define different access levels for both users and user groups where they can only see authorized data. Access rights can be defined at different levels: functional level (e.g., loan statistics only), location level (e.g., only for branch A) or analysis level (e.g., specific criteria).

Dynamic analytics tools

Analysis

Not only are our analytics tools dynamic but they can also be used to discover on-the-fly insight. Additionally, users can combine multiple criteria to answer more complex questions such as “the distribution by age and gender of users living in a specific town who borrowed more than nine materials last year and also subscribed to a newsletter.” This type of analysis can easily be performed because all criteria from a cube can act as a “restriction” for the request.

Without technical barrier

Ease of use and implementation

V-insight unites strength and speed of implementation. It does not require any pre-configuration. Set up and training can also be accomplished quickly. Therefore, it achieves a high ROI. Technology is transparent with a user-friendly navigation so users only focus on their objective with no technical barrier.

  • Easy-to-use navigation and automatic clustering of data ensure an improved user experience.
  • Statistical information can be shared without any IT support or application manager action.
  • V-insight can be configured via its preferences application where settings include users, user groups, cubes, dashboards and tasks. Library managers decide who can view and analyze data.
  • The Open V-insight product is an open solution and can process the most diverse data types, regardless of the data’s origin. Whatever the source is, data import into the system can be fully automated and run without human intervention.

Beyond analysis

Become a customer-oriented organization

V-insight is an integral part of our user centered architecture (UCA) approach and supports libraries as they become a customer-oriented organization and better adapt to trends and patrons needs with user’s behavior analysis. Individual records can easily be exported from dashboards to Microsoft® Excel® allowing immediate action and highly targeted marketing campaigns based on e.g. customer interests, subscriptions type, membership renewal dates, and low or high material demand.

V-insight delivers multiple types of statistics

  • Vital data about collection usage—What parts of the collection are used too little? What percentage is on the shelf? What is the loan frequency?
  • Marketing statistics—Powerful functions to slice and dice data and drilldown to individual customer records can be used for mail merge and direct marketing campaigns.
  • General statistics—Key performance indicators (KPIs) can be analyzed with the available functions: compare, analyze, limit, and others. Trends become visible.
  • Database maintenance—A particularly useful side-effect of V-insight is that data quality (or the lack thereof) becomes clear. Because data can then act as input for manual (individual) and global changes, data quality can be improved.

V-insight special analytics functions

Slice and dice

Click on a part of a pie to view only data for the segment in question. Use all criteria in a cube as a restriction. There is support for a wide range of operators (greater than, smaller than, equal to, follows, contains, equal to one of, of a certain size or pattern such as “starts with a capital letter and ends with a dot”). Data from different cubes can be combined for even deeper analysis.

Hot lists

This feature shows the most popular works (for items or descriptions). For example, users can determine “what is loaned most often or reserved or most viewed on the website in a particular year or quarter.” These lists can be viewed at a global level and also for specific types of materials (e.g., DVDs only), customer categories (e.g., only customers with membership "Top"), age groups (for example, only children under five) or location (only at a certain branch) and topic groups (e.g., only music from the "soul" category).

Easy dashboards

Dashboards offer quick visual analysis. Users gain access to statistics via easy-to-use dropdown lists, based on rights and preferences. The dashboard overviews are generated dynamically; statistical analyzes are not based on static data, but are produced in real time, allowing users to create all kinds of data overviews on request.

V-insight Widgets (add-on module)

Will allow you to show your dashboards graphs outside the V-insight interface: a graph or statistical results can be published dynamically on e.g. the library’s web page.

Data grouping

A particularly useful feature is the capability to group data either at storage in the data warehouse or in the display, as well as translating data code into meaningful descriptions. For example, even though customer ages are stored as a number (e.g., 9 nine years old), the results can be grouped as desired by the library such as 0-4= Toddler, 5-12=Youth, 13-19=Teen, etc. for easier visualization.

Easily import data with Open V-insight

The V-smart ILS is the default data source of V-insight. An additional application, Open V-insight, allows to import data from external resources. It supports any source and can process the most diverse types of data, regardless of its origin. Imports can be generated automatically enabling data processing without human intervention.

Learn more about V-smart

Key features at a glance

Visualization and export

Data visualization with multiple display options and global export of statistical data, export to Excel, printer, PDF, JPG, SVG and PNG formats.

Automatic export

Scheduled, automatic export to server folders.

Data comparison

Extensive capabilities for data comparison such as year on year comparison or specific month over several years comparison.

Advanced and combined

Advanced analysis including restrictions, "scoping," or grouping data and combine data analysis stored in different cubes.

Behind the digits

Drilldown to individual records behind the digits.

Unique interface

A unique pick and click interface, which enables users to select criteria and adjust analyzes in a simple manner.

Dashboard creation

Creation of private or group dashboards and breakdown of dashboards according to available values, data updates and processing.

Specific data

Restrictions for analyzing specific data and zoom in by clicking on parts of graphs.

Group

Group and cluster relevant information and group “small values” into a single category.

Share reports

Upload and share statistical reports and documents.

Get the latest news in your mailbox with our newsletter

Select your areas of interest: